Illustration of the Back-and-Forth Method#
import sys
import os
sys.path.append(os.path.abspath("../.."))

import numpy as np
import numpy.ma as ma
from scipy.fftpack import dctn, idctn
import matplotlib.pyplot as plt
import matplotlib.patches as patches
from time import time
from BFOT.BFOT import BFM
import cProfile
import pstats
---------------------------------------------------------------------------
ModuleNotFoundError                       Traceback (most recent call last)
Cell In[1], line 11
      9 import matplotlib.patches as patches
     10 from time import time
---> 11 from BFOT.BFOT import BFM
     12 import cProfile
     13 import pstats

File ~/work/BFOT/BFOT/BFOT/BFOT.py:2
      1 import numpy as np
----> 2 import numba
      3 from numba import prange
      4 from scipy.signal import convolve2d

ModuleNotFoundError: No module named 'numba'
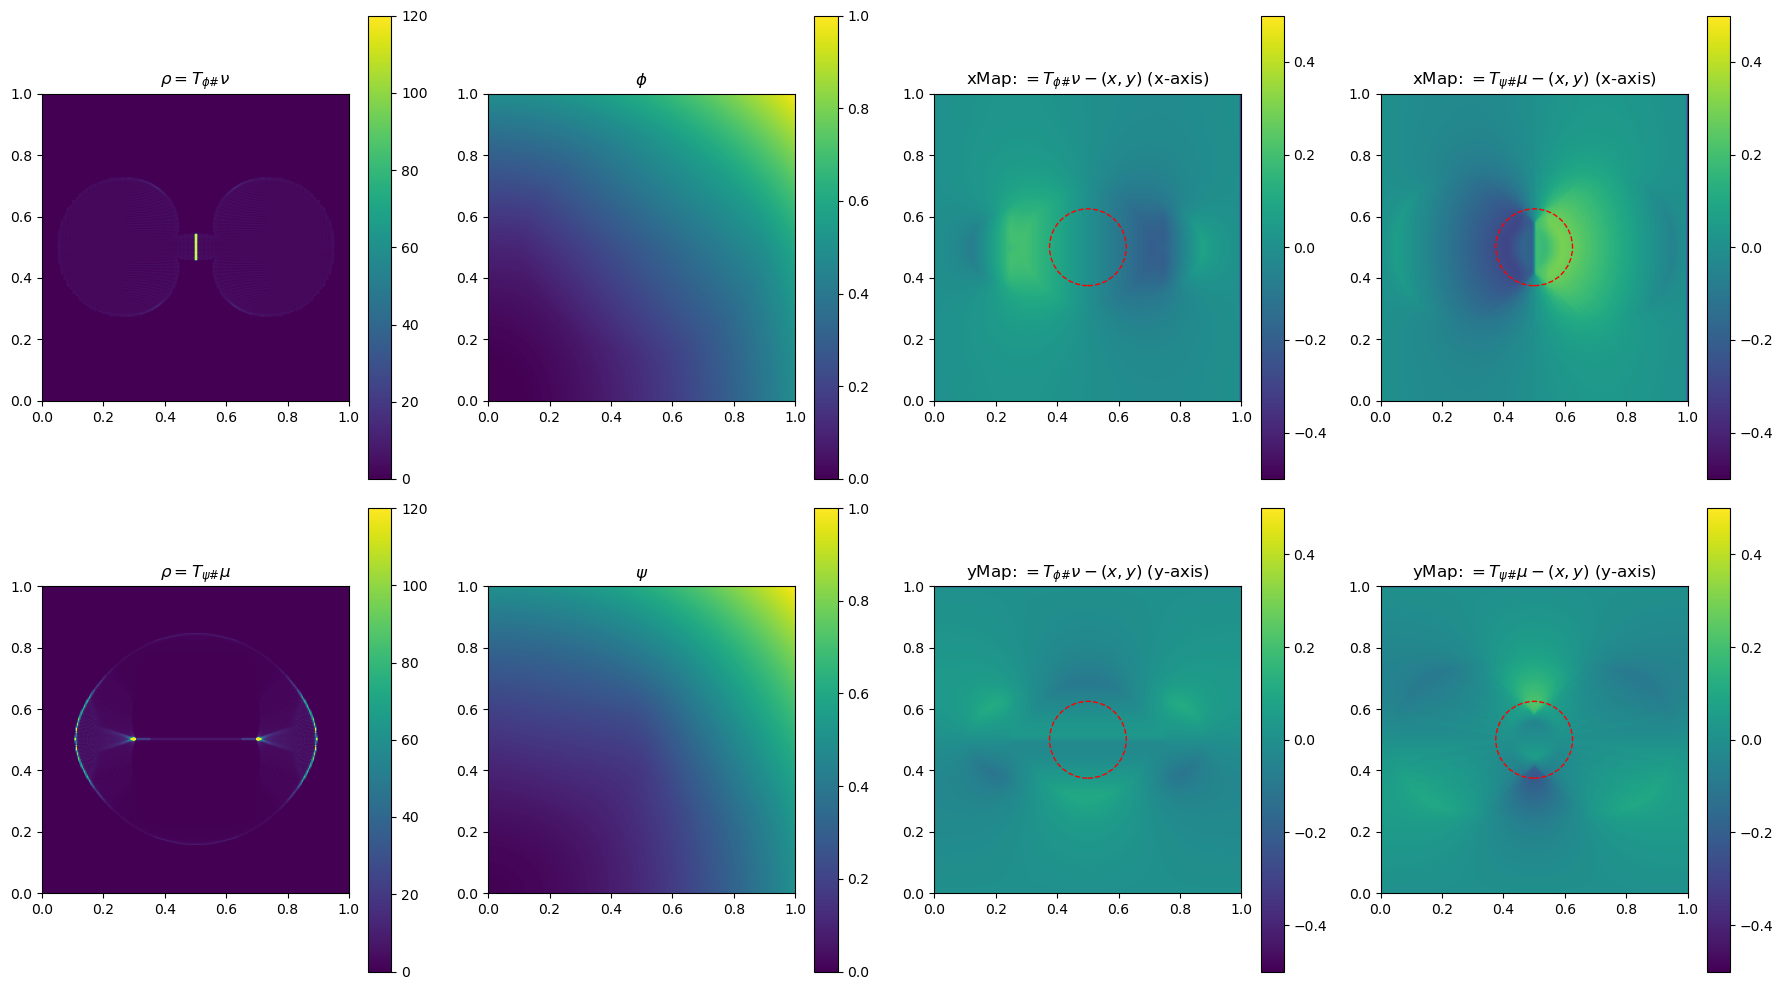
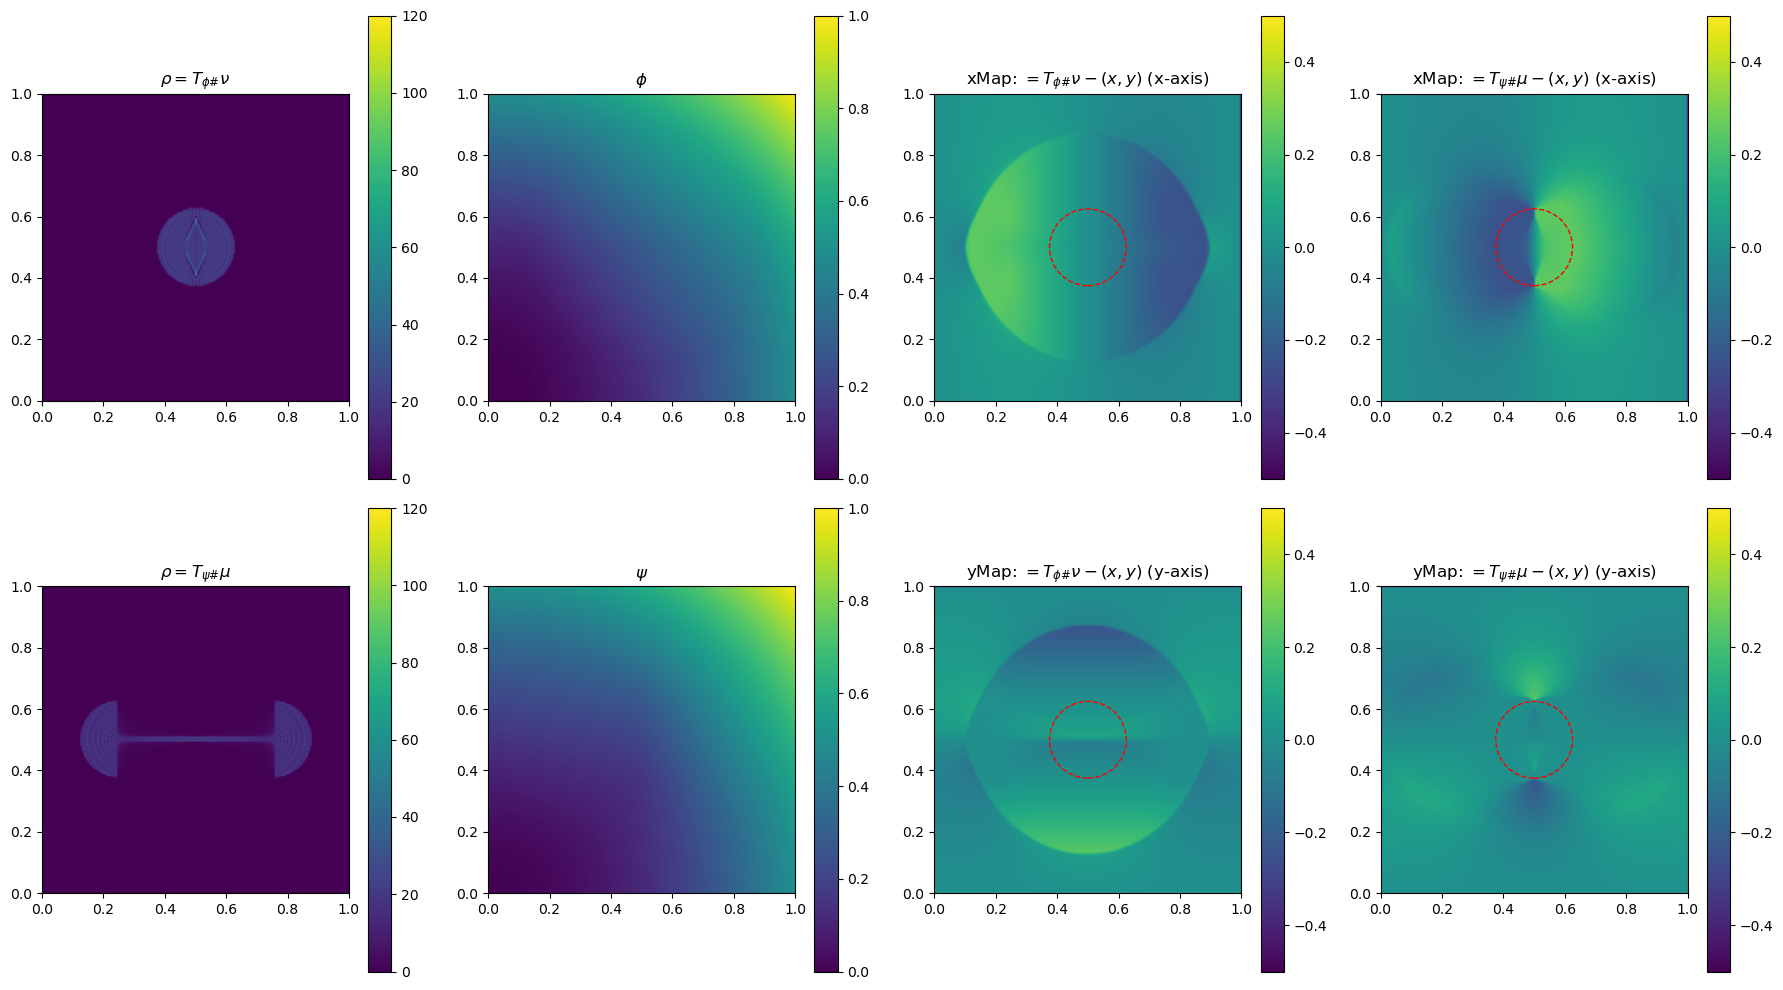
Visualizing the Method#
In the section below, we use a 2-D example to illustrate the method by plotting \(\phi\), \(\phi\), \(\rho=T_{\psi\#}\mu\) and \(\rho=T_{\phi\#}\nu\)(used to determine the gradient of the objective function for the next update), and the x and yMap(each representing one dimension of the transformation \(T_{\psi\#}\)) after every 5 iterations. This helps us get a sense of how the underlying variables evolve over iterations.
plt.rcParams['figure.figsize'] = (13, 8)
plt.rcParams['image.cmap'] = 'viridis'

# Function definitions

def initialize_kernel(n1, n2):
    xx, yy = np.meshgrid(np.linspace(0, np.pi, n1, False), np.linspace(0, np.pi, n2, False))
    kernel = 2 * n1 * n1 * (1 - np.cos(xx)) + 2 * n2 * n2 * (1 - np.cos(yy))
    kernel[0, 0] = 1  # to avoid dividing by zero
    return kernel

def dct2(a):
    #discrete cosine transform
    return dctn(a, norm='ortho')

def idct2(a):
    #inverse discrete cosine transform
    return idctn(a, norm='ortho')

def update_potential(phi, rho, nu, kernel, sigma):
    n1, n2 = nu.shape
    rho -= nu
    workspace = dct2(rho) / kernel
    workspace[0, 0] = 0
    workspace = idct2(workspace)
    phi += sigma * workspace
    h1 = np.sum(workspace * rho) / (n1 * n2)
    return h1

def compute_w2(phi, psi, mu, nu, x, y):
    n1, n2 = mu.shape
    return np.sum(0.5 * (x * x + y * y) * (mu + nu) - nu * phi.reshape((n1, n2)) - mu * psi.reshape((n1, n2))) / (n1 * n2)

def stepsize_update(sigma, value, oldValue, gradSq):
    scaleDown = 0.95
    scaleUp = 1 / scaleDown
    upper = 0.75
    lower = 0.25
    diff = value - oldValue
    if diff > gradSq * sigma * upper:
        return sigma * scaleUp
    elif diff < gradSq * sigma * lower:
        return sigma * scaleDown
    return sigma

import matplotlib.pyplot as plt
import numpy as np

def compute_ot(phi, psi, bf, sigma):
    kernel = initialize_kernel(n1, n2)
    rho = np.copy(mu)
    oldValue = compute_w2(phi, psi, mu, nu, x, y)

    for k in range(numIters + 1):
        # Perform gradient and potential updates
        gradSq = update_potential(phi, rho, nu, kernel, sigma)
        bf.ctransform(psi, phi)
        bf.ctransform(phi, psi)
        value = compute_w2(phi, psi, mu, nu, x, y)
        sigma = stepsize_update(sigma, value, oldValue, gradSq)
        oldValue = value
        bf.pushforward(rho, phi, nu)
        if k % 5 == 0:
            fig, ax = plt.subplots(2, 4, figsize=(18, 10))

            # Plot rho
            im0 = ax[0, 0].imshow(rho, origin='lower', extent=(0, 1, 0, 1), vmin=0, vmax=120)
            ax[0, 0].set_title("$\\rho=T_{\\phi\\#}\\nu$")
            fig.colorbar(im0, ax=ax[0, 0], orientation='vertical')

            # Define circle parameters
            center = (0.5, 0.5)  # Center of the circle
            radius = 0.125       # Radius of the circle
            # Create the circle patch
            circle = patches.Circle(center, radius, edgecolor='red', facecolor='none', linestyle='--', linewidth=1)

            # Plot xMap
            im4 = ax[0, 2].imshow(bf.xMap[1:, 1:] - x, origin='lower', extent=(0, 1, 0, 1), vmin=-0.5, vmax=0.5)
            ax[0, 2].set_title(r"xMap: $=T_{\phi\#}\nu-(x,y)$ (x-axis)")
            fig.colorbar(im4, ax=ax[0, 2], orientation='vertical')
            # Add the circle to the xMap plot
            ax[0, 2].add_patch(circle)

            # Plot yMap
            im5 = ax[1, 2].imshow(bf.yMap[1:, 1:] - y, origin='lower', extent=(0, 1, 0, 1), vmin=-0.5, vmax=0.5)
            ax[1, 2].set_title(r"yMap: $=T_{\phi\#}\nu-(x,y)$ (y-axis)")
            fig.colorbar(im5, ax=ax[1, 2], orientation='vertical')
            # Create the circle patch
            circle = patches.Circle(center, radius, edgecolor='red', facecolor='none', linestyle='--', linewidth=1)
            # Add the circle to the yMap plot
            ax[1, 2].add_patch(circle)

        # Update potential and pushforward for psi
        gradSq = update_potential(psi, rho, mu, kernel, sigma)
        bf.ctransform(phi, psi)
        bf.ctransform(psi, phi)
        bf.pushforward(rho, psi, mu)

        # Plot every 5 iterations
        if k % 5 == 0:
            # Plot rho
            im1 = ax[1, 0].imshow(rho, origin='lower', extent=(0, 1, 0, 1), vmin=0, vmax=120)
            ax[1, 0].set_title("$\\rho=T_{\\psi\\#}\\mu$")
            fig.colorbar(im1, ax=ax[1, 0], orientation='vertical')

            # Plot phi
            im2 = ax[0, 1].imshow(phi, origin='lower', extent=(0, 1, 0, 1), vmin=0, vmax=1)
            ax[0, 1].set_title("$\\phi$")
            fig.colorbar(im2, ax=ax[0, 1], orientation='vertical')

            # Plot psi
            im3 = ax[1, 1].imshow(psi, origin='lower', extent=(0, 1, 0, 1), vmin=0, vmax=1)
            ax[1, 1].set_title("$\\psi$")
            fig.colorbar(im3, ax=ax[1, 1], orientation='vertical')

            # Define circle parameters
            center = (0.5, 0.5)  # Center of the circle
            radius = 0.125       # Radius of the circle
            # Create the circle patch
            circle = patches.Circle(center, radius, edgecolor='red', facecolor='none', linestyle='--', linewidth=1)
            # Plot xMap
            im6 = ax[0, 3].imshow(bf.xMap[1:, 1:] - x, origin='lower', extent=(0, 1, 0, 1), vmin=-0.5, vmax=0.5)
            ax[0, 3].set_title(r"xMap: $=T_{\psi\#}\mu-(x,y)$ (x-axis)")
            fig.colorbar(im4, ax=ax[0, 3], orientation='vertical')
            # Add the circle to the xMap plot
            ax[0, 3].add_patch(circle)

            # Plot yMap
            im7 = ax[1, 3].imshow(bf.yMap[1:, 1:] - y, origin='lower', extent=(0, 1, 0, 1), vmin=-0.5, vmax=0.5)
            ax[1, 3].set_title(r"yMap: $=T_{\psi\#}\mu-(x,y)$ (y-axis)")
            fig.colorbar(im5, ax=ax[1, 3], orientation='vertical')
            # Create the circle patch
            circle = patches.Circle(center, radius, edgecolor='red', facecolor='none', linestyle='--', linewidth=1)
            # Add the circle to the yMap plot
            ax[1, 3].add_patch(circle)


            # Plot W2 value evolution
            #ax[1, 2].plot(k, value, 'bo')
            #ax[1, 2].set_title("W2 value")
            #ax[1, 2].set_xlabel("Iterations")
            #ax[1, 2].set_ylabel("W2")

            plt.tight_layout()
            plt.show()

        # Logging the values
        if k % 10 == 0:
            print(f'iter {k:4d},   W2 value: {value:.6e},   H1 err: {gradSq:.2e}')
        #if k % 10 == 0:
            #print(bf.xMap, bf.yMap)

        # Update stepsize and oldValue for next iteration
        sigma = stepsize_update(sigma, value, oldValue, gradSq)
        oldValue = value
n1 = 256
n2 = 256
x, y = np.meshgrid(np.linspace(0.5 / n1, 1 - 0.5 / n1, n1), np.linspace(0.5 / n2, 1 - 0.5 / n2, n2))
phi = 0.5 * (x * x + y * y)
psi = 0.5 * (x * x + y * y)
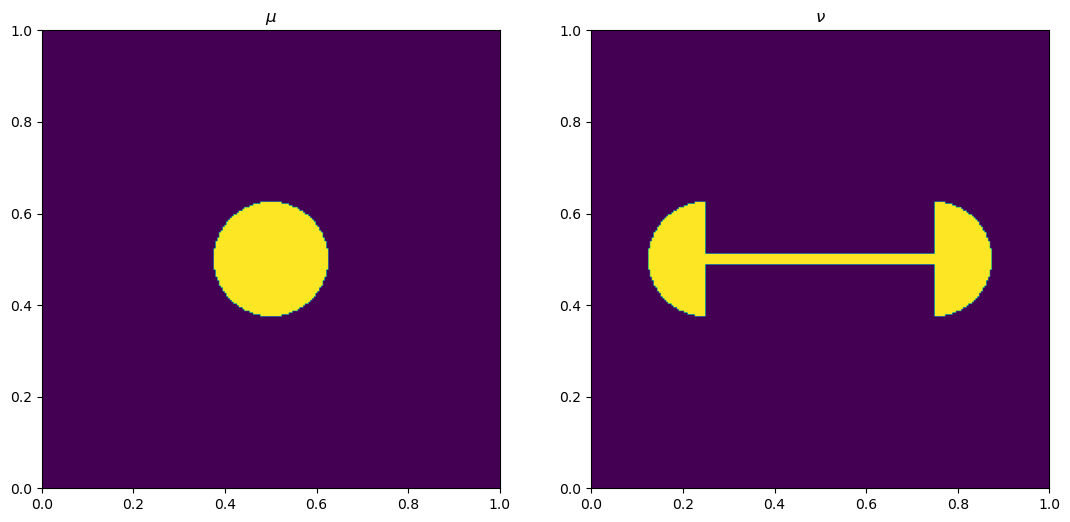
mu = np.zeros((n1, n2))
r = 0.125
mu[(x - 0.5) ** 2 + (y - 0.5) ** 2 < r ** 2] = 1
nu = np.zeros((n2, n1))
idx = (((x - 0.25) ** 2 + (y - 0.5) ** 2 < r ** 2) & (x < 0.25))
idx = idx | (((x - 0.75) ** 2 + (y - 0.5) ** 2 < r ** 2) & (x > 0.75))
idx = idx | ((x < 0.751) & (x > 0.249) & (y < 0.51) & (y > 0.49))
nu[idx] = 1
mu *= n1 * n2 / np.sum(mu)
nu *= n1 * n2 / np.sum(nu)
fig, ax = plt.subplots(1, 2)
ax[0].imshow(mu, origin='lower', extent=(0, 1, 0, 1))
ax[0].set_title("$\\mu$")
ax[1].imshow(nu, origin='lower', extent=(0, 1, 0, 1))
ax[1].set_title("$\\nu$")
numIters = 50
sigma = 4 / np.maximum(mu.max(), nu.max())
def main():
bf = BFM(n1, n2, mu)
compute_ot(phi, psi, bf, sigma)
if __name__ == "__main__":
profiler = cProfile.Profile()
profiler.enable()
main()
profiler.disable()
stats = pstats.Stats(profiler)
stats.sort_stats('tottime').print_stats(10)
iter 0, W2 value: 1.978022e-02, H1 err: 7.98e-02


iter 10, W2 value: 2.513125e-02, H1 err: 5.06e-04


iter 20, W2 value: 2.514307e-02, H1 err: 2.38e-04

iter 30, W2 value: 2.514623e-02, H1 err: 1.18e-05


iter 40, W2 value: 2.514599e-02, H1 err: 1.16e-05


iter   50,   W2 value: 2.514593e-02,   H1 err: 1.16e-05
         56213558 function calls (54953600 primitive calls) in 49.115 seconds

   Ordered by: internal time
   List reduced from 1874 to 10 due to restriction <10>

   ncalls  tottime  percall  cumtime  percall filename:lineno(function)
   104448   15.322    0.000   19.572    0.000 /Users/liuqian/Documents/BFOT/BFOT/BFOT.py:68(compute_dual)
      102   10.645    0.104   12.051    0.118 /Users/liuqian/Documents/BFOT/BFOT/BFOT.py:144(sampling_pushforward)
   104448    1.406    0.000    1.406    0.000 {method 'searchsorted' of 'numpy.ndarray' objects}
   818979    1.400    0.000    1.400    0.000 {method 'reduce' of 'numpy.ufunc' objects}
       56    1.035    0.018    1.035    0.018 {method 'encode' of 'ImagingEncoder' objects}
   104448    0.810    0.000    2.476    0.000 /Users/liuqian/Documents/BFOT/BFOT/BFOT.py:106(compute_dual_indices)
  8506846    0.779    0.000    0.780    0.000 {built-in method builtins.max}
  6900306    0.589    0.000    0.589    0.000 {built-in method builtins.min}
911729/651758    0.425    0.000    3.924    0.000 {built-in method numpy.core._multiarray_umath.implement_array_function}
1119213/801513    0.383    0.000    0.628    0.000 /Users/liuqian/anaconda3/lib/python3.11/site-packages/matplotlib/artist.py:319(stale)
Visualizng the ‘sampling_pushforward’#
# initialize mu, nu
n1 = 10
n2 = 10
x, y = np.meshgrid(np.linspace(0.5 / n1, 1 - 0.5 / n1, n1), np.linspace(0.5 / n2, 1 - 0.5 / n2, n2))
phi = 0.5 * (x * x + y * y)
psi = 0.5 * (x * x + y * y)

mu = np.zeros((n1, n2))
r = 0.125
mu[(x - 0.5) ** 2 + (y - 0.5) ** 2 < r ** 2] = 1
nu = np.zeros((n2, n1))
idx = (((x - 0.25) ** 2 + (y - 0.5) ** 2 < r ** 2) & (x < 0.25))
idx = idx | (((x - 0.75) ** 2 + (y - 0.5) ** 2 < r ** 2) & (x > 0.75))
idx = idx | ((x < 0.751) & (x > 0.249) & (y < 0.51) & (y > 0.49))
nu[idx] = 1

mu *= n1 * n2 / np.sum(mu)
nu *= n1 * n2 / np.sum(nu)

# initialize rho
rho = np.copy(mu)

# initialize xMap and yMap(itr30)
xMap = np.array([[0.0125, 0.0375, 0.05, 0.05894062, 0.15737972, 0.43769621, 0.73901576, 0.87161685, 0.91871642, 0.70935821, 0.2375],
                 [0.0125, 0.0375, 0.05, 0.05447031, 0.15286774, 0.44216627, 0.74361055, 0.87170571, 0.91872798, 0.70936399, 0.2375],
                 [0.0125, 0.0375, 0.05, 0.05, 0.14835576, 0.44663632, 0.75173859, 0.88042616, 0.92540301, 0.71093489, 0.2375],
                 [0.0125, 0.0375, 0.05, 0.05, 0.14835576, 0.45016956, 0.77130507, 0.91052451, 0.94103324, 0.7125, 0.2375],
                 [0.0125, 0.0375, 0.05, 0.05, 0.14675167, 0.45949898, 0.80374294, 0.94099564, 0.95, 0.7125, 0.2375],
                 [0.0125, 0.0375, 0.05, 0.05, 0.14514758, 0.46529516, 0.82014758, 0.95, 0.95, 0.7125, 0.2375],
                 [0.0125, 0.0375, 0.05, 0.05, 0.14675167, 0.45949898, 0.80374294, 0.94099564, 0.95, 0.7125, 0.2375],
                 [0.0125, 0.0375, 0.05, 0.05, 0.14835576, 0.45016956, 0.77130507, 0.91052451, 0.94103324, 0.7125, 0.2375],
                 [0.0125, 0.0375, 0.05, 0.05, 0.14835576, 0.44663632, 0.75173859, 0.88042616, 0.92540301, 0.71093489, 0.2375],
                 [0.0125, 0.0375, 0.05, 0.05447031, 0.15286774, 0.44216627, 0.74361055, 0.87170571, 0.91872798, 0.70936399, 0.2375],
                 [0.0125, 0.0375, 0.05, 0.05894062, 0.15737972, 0.43769621, 0.73901576, 0.87161685, 0.91871642, 0.70935821, 0.2375]])

yMap = np.array([[0.08737744, 0.08737744, 0.08737744, 0.08737744, 0.08290713, 0.08286546, 0.08737718, 0.08746025, 0.08746603, 0.08747181, 0.08747181],
                 [0.26225487, 0.26225487, 0.26225487, 0.26225487, 0.25331425, 0.25323092, 0.26225436, 0.26595375, 0.27106366, 0.27264034, 0.27264034],
                 [0.34987744, 0.34987744, 0.34987744, 0.34987744, 0.34540713, 0.34536546, 0.35341042, 0.37305997, 0.39222922, 0.39536523, 0.39536523],
                 [0.36019945, 0.36019945, 0.36019945, 0.36019945, 0.36019945, 0.35859536, 0.37306211, 0.41059972, 0.43363159, 0.43519671, 0.43519671],
                 [0.40789891, 0.40789891, 0.40789891, 0.40789891, 0.40789891, 0.40469073, 0.42302451, 0.45353324, 0.4625, 0.4625, 0.4625],
                 [0.5, 0.5, 0.5, 0.5, 0.5, 0.5, 0.5, 0.5, 0.5, 0.5, 0.5],
                 [0.59210109, 0.59210109, 0.59210109, 0.59210109, 0.59210109, 0.59530927, 0.57697549, 0.54646676, 0.5375, 0.5375, 0.5375],
                 [0.63980055, 0.63980055, 0.63980055, 0.63980055, 0.63980055, 0.64140464, 0.62693789, 0.58940028, 0.56636841, 0.56480329, 0.56480329],
                 [0.65012256, 0.65012256, 0.65012256, 0.65012256, 0.65459287, 0.65463454, 0.64658958, 0.62694003, 0.60777078, 0.60463477, 0.60463477],
                 [0.48774513, 0.48774513, 0.48774513, 0.48774513, 0.49668575, 0.49676908, 0.48774564, 0.48404625, 0.47893634, 0.47735966, 0.47735966],
                 [0.16262256, 0.16262256, 0.16262256, 0.16262256, 0.16709287, 0.16713454, 0.16262282, 0.16253975, 0.16253397, 0.16252819, 0.16252819]])
def sampling_pushforward(self, mu):
    pcount = self.n1 * self.n2
    self.rho.fill(0)

    for i in range(self.n1):
        for j in range(self.n2):
            mass = mu[i, j]
            if mass > 0:

                xStretch0 = abs(self.xMap[i, j + 1] - self.xMap[i, j])
                xStretch1 = abs(self.xMap[i + 1, j + 1] - self.xMap[i + 1, j])

                yStretch0 = abs(self.yMap[i + 1, j] - self.yMap[i, j])
                yStretch1 = abs(self.yMap[i + 1, j + 1] - self.yMap[i, j + 1])

                xStretch = max(xStretch0, xStretch1)
                yStretch = max(yStretch0, yStretch1)

                xSamples = max(int(self.n1 * xStretch), 1)
                ySamples = max(int(self.n2 * yStretch), 1)

                factor = 1 / (xSamples * ySamples)

                for l in range(ySamples):
                    for k in range(xSamples):
                        a = (k + 0.5) / xSamples
                        b = (l + 0.5) / ySamples

                        xPoint = (1 - b) * (1 - a) * self.xMap[i, j] + (1 - b) * a * self.xMap[i, j + 1] + b * (1 - a) * self.xMap[i + 1, j] + a * b * self.xMap[i + 1, j + 1]
                        yPoint = (1 - b) * (1 - a) * self.yMap[i, j] + (1 - b) * a * self.yMap[i, j + 1] + b * (1 - a) * self.yMap[i + 1, j] + a * b * self.yMap[i + 1, j + 1]

                        X = xPoint * self.n1 - 0.5
                        Y = yPoint * self.n2 - 0.5

                        xIndex = int(X)
                        yIndex = int(Y)

                        xFrac = X - xIndex
                        yFrac = Y - yIndex

                        xOther = xIndex + 1
                        yOther = yIndex + 1

                        xIndex = min(max(xIndex, 0), self.n1 - 1)
                        xOther = min(max(xOther, 0), self.n1 - 1)

                        yIndex = min(max(yIndex, 0), self.n2 - 1)
                        yOther = min(max(yOther, 0), self.n2 - 1)

                        idx = yIndex, xIndex
                        idx_yOther = yOther, xIndex
                        idx_xOther = yIndex, xOther
                        idx_xyOther = yOther, xOther

                        self.rho[idx] += (1 - xFrac) * (1 - yFrac) * mass * factor
                        self.rho[idx_yOther] += (1 - xFrac) * yFrac * mass * factor
                        self.rho[idx_xOther] += xFrac * (1 - yFrac) * mass * factor
                        self.rho[idx_xyOther] += xFrac * yFrac * mass * factor

    sum_rho = np.sum(self.rho) / pcount
    self.rho *= self.totalMass / sum_rho
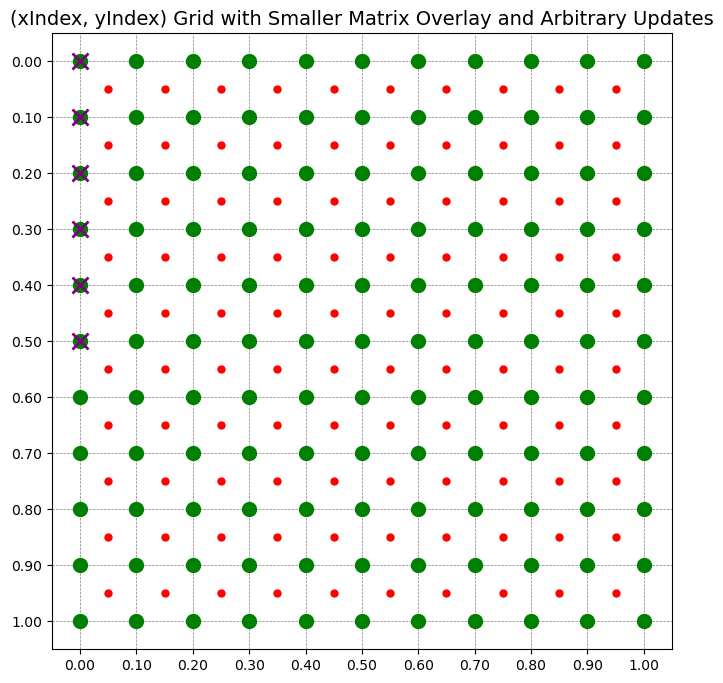
def plot_matrix_with_overlay_and_updates(main_matrix, overlay_matrix=None, mark_updates=None):
"""
Plot a main matrix as a grid with optional overlay matrix in the center, allowing updates at arbitrary points.
Parameters:
- main_matrix (np.ndarray): The main grid matrix.
- overlay_matrix (np.ndarray, optional): A smaller matrix centered within the main matrix.
- mark_updates (list of tuples, optional): List of (x, y) coordinates to mark with an 'X'.
"""
n_rows, n_cols = main_matrix.shape
fig, ax = plt.subplots(figsize=(8, 8))
# Plot main matrix
for i in range(n_rows):
for j in range(n_cols):
ax.plot(j, n_rows - i - 1, 'o', color='green', markersize=10) # Green for main matrix
# Set grid lines for main matrix
ax.set_xticks(np.arange(0, n_cols, 1))
ax.set_yticks(np.arange(0, n_rows, 1))
ax.set_xticklabels([f'{j/(n_cols-1):.2f}' for j in range(n_cols)])
ax.set_yticklabels([f'{i/(n_rows-1):.2f}' for i in range(n_rows)])
ax.grid(which='both', color='gray', linestyle='--', linewidth=0.5)
# Plot overlay matrix if provided
if overlay_matrix is not None:
n_rows_overlay, n_cols_overlay = overlay_matrix.shape
for i in range(n_rows_overlay):
for j in range(n_cols_overlay):
x = j + 0.5 # Shift by 0.5 to center between grid points
y = n_rows - i - 1.5
ax.plot(x, y, 'o', color='red', markersize=5) # Red for overlay matrix
# Mark arbitrary update points
if mark_updates:
for (x, y) in mark_updates:
ax.plot(x, y, 'x', color='purple', markersize=12, mew=2)
# Set limits and labels
ax.set_xlim(-0.5, n_cols - 0.5)
ax.set_ylim(-0.5, n_rows - 0.5)
ax.invert_yaxis()
ax.set_title("(xIndex, yIndex) Grid with Smaller Matrix Overlay and Arbitrary Updates", fontsize=14)
plt.show()
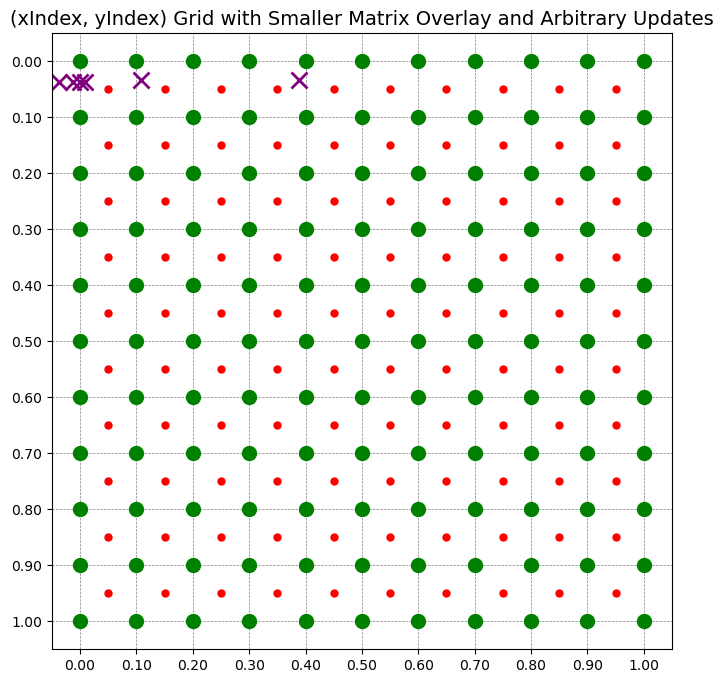
def plot_pushforward(update_list, xMap, yMap, n1, n2, rho):
"""
Plot the initial and pushforward positions in the same subplot by calling
plot_matrix_with_overlay_and_updates twice on the same axes.
Parameters:
- update_list (list of tuples): Initial list of points to mark.
- xMap (np.ndarray): x-coordinates of the mapping.
- yMap (np.ndarray): y-coordinates of the mapping.
- n1 (int): Scaling factor for x-coordinates.
- n2 (int): Scaling factor for y-coordinates.
- rho (np.ndarray): Overlay matrix (e.g., density or grid values).
"""
# Prepare initial and updated points
mark_updates_before = update_list
mark_updates_after = []
for (i, j) in mark_updates_before:
x_new = xMap[i, j] * n1 - 0.5
y_new = yMap[i, j] * n2 - 0.5
mark_updates_after.append((x_new, y_new))
# First call to plot_matrix_with_overlay_and_updates for initial points
plot_matrix_with_overlay_and_updates(xMap, rho, mark_updates_before)
# Second call to plot_matrix_with_overlay_and_updates for pushforward points
plot_matrix_with_overlay_and_updates(xMap, rho, mark_updates_after)
update_list = [(0, 0), (0, 1), (0, 2), (0, 3), (0, 4), (0, 5)]
plot_pushforward(update_list, xMap, yMap, n1, n2, rho)